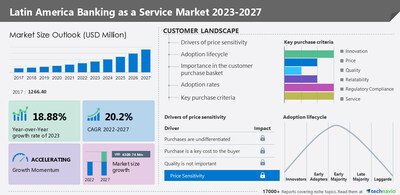
NEW YORK, May 26, 2023 /PRNewswire/ — The banking as a service (BaaS) market size in Latin America is estimated to increase by USD 4,309.74 million, accelerating at a CAGR of 20.2% during the forecast. The growth of the market is driven by the increasing adoption of BaaS solutions by end-users. However, the implementation and data security challenges may hamper the market growth.

Discover market potential and make informed business decisions based on qualitative and quantitative evidence highlighted in Technavio reports- Request a sample report
Banking as a Service Market in Latin America – Market Dynamics
Leading drivers- Increasing adoption of BaaS solutions by end-users is a primary factor driving the banking as a service (BaaS) market in Latin America market growth. BaaS platforms offer a diverse range of financial services for consumers to choose from, providing added benefits such as convenience, speed, and a wide selection of payment options. By integrating BaaS functionality into their products, NBFCs are able to provide hassle-free customer experiences, including bank accounts, digital wallets, lending, and payments.
Key trends – Increasing marketing initiatives is a major trend in the Latin America BaaS market. Vendors create advertisement campaigns followed by marketing campaigns that include internet pre-roll, a wide-reaching social media and blogging program, and an interactive website. They also use social media channels such as Instagram to showcase ideas and increase their market reach.
Major challenges – Implementation and data security challenges is a major concern hindering the market growth. Legal and security concerns are the top barriers, followed by a lack of understanding of the available product and the need to onboard additional service providers. Organizations are skeptical about deploying BaaS for their operations, which can become a major challenge for the growth of the banking as a service (BaaS) market in Latin America during the forecast period.
In addition to the forecast, the report also highlights the key opportunities by analyzing drivers, trends, and challenges for the market!
Banking as a Service Market in Latin America– Customer Landscape
To help companies evaluate and develop growth strategies, the report outlines –
- Key purchase criteria
- Adoption rates
- Adoption lifecycle
- Drivers of price sensitivity
Banking as a Service Market in Latin America– Vendor Analysis
Some of the major Banking as a Service Market vendors in Latin America are:
- Alau Technology SAU
- Banco Inter S.A.
- Banco Sabadell SA
- BICECORP SA
- Credijusto
- Creditas
- Cuenca Tecnología Financiera SA de CV
- DOCK
- EBANX
- GIRE SA
- Inteligencia en Finanzas S.A.P.I. de C.V.
- Klar SA de CV
- Maximo Pay SAC
- MEXARREND S.A.P.I. DE C.V.
- Neon Pagamentos S.A.
- Nu Holdings Ltd.
- Rappi Inc.
- Revolut Ltd.
- Servicios Broxel SAPI de CV
- UNIVERSO ONLINE SA
The Banking as a Service Market in Latin America is fragmented, with the presence of several global as well as regional vendors. The degree of fragmentation will accelerate during the forecast period.
Vendor offerings –
- Uala.com.ar- The company offers banking-as-a-service through Uala App.
- bicecorp.com- The company offers banking-as-a-service through its subsidiary Banco BICE.
- cuenca.com- The company offers banking-as-a-service such as electronic payment funds accounts.
- ebanx.com- The company offers banking-as-a-service such as payment processing with international funds settlement, domestic funds settlement and payouts.
- gire.com- The company offers banking-as-a-service through its subsidiary Banco BICE.
- For Details on the vendor and its offerings – Buy the report!
Banking as a Service Market in Latin America– Segmentation Assessment
The banking as a Service Market in Latin America is segmented as below:
- Component
- Platform
- Services
- Type
- Cloud-based
- API-based
- End-user
- Large enterprise
- Small
- Medium enterprise
For insights on global, regional, and country-level parameters with growth opportunities from 2017 to 2027 Download a Sample Report
What are the key data covered in this Banking As A Service Market In Latin America report?
- CAGR of the market during the forecast period
- Detailed information on factors that will drive the growth of the Banking as a Service Market in Latin America between 2023 and 2027
- Precise estimation of the size of the Banking as a Service Market size in Latin America and its contribution to the market in focus on the parent market
- Accurate predictions about upcoming trends and changes in consumer behavior
- Growth of the Banking as a Service Market across Latin America
- A thorough analysis of the market’s competitive landscape and detailed information about vendors
- Comprehensive analysis of factors that will challenge the growth of Banking as a Service Market vendors in Latin America
Gain instant access to 17,000+ market research reports.
Technavio’s SUBSCRIPTION platform
Related Reports:
Banking as a Service Market– The Global Banking as a Service Market size is estimated to grow by USD 21,806.94 million between 2022 and 2027 accelerating at a CAGR of 14.62%.
Community Banking Market– The community banking market is estimated to grow at a CAGR of 5.3% between 2022 and 2027. The size of the market is forecast to increase by USD 207.21 billion.
|
Banking As A Service Market In Latin America Scope |
|
|
Report Coverage |
Details |
|
Historic period |
2017-2021 |
|
Forecast period |
2023-2027 |
|
Growth momentum & CAGR |
Accelerate at a CAGR of 20.2% |
|
Market growth 2023-2027 |
USD 4309.74 million |
|
Market structure |
Fragmented |
|
YoY growth 2022-2023 (%) |
18.88 |
|
Regional analysis |
Latin America |
|
Performing market contribution |
Latin America at 100% |
|
Key countries |
Brazil, Mexico, Colombia, Argentina, and Rest of Latin America, Canada, Mexico, Italy, Spain, India, Japan, Australia, and South Korea |
|
Competitive landscape |
Leading Vendors, Market Positioning of Vendors, Competitive Strategies, and Industry Risks |
|
Key companies profiled |
Alau Technology SAU, Banco Inter S.A., Banco Sabadell SA, BICECORP SA, Credijusto, Creditas, Cuenca Tecnología Financiera SA de CV, DOCK, EBANX, GIRE SA, Inteligencia en Finanzas S.A.P.I. de C.V., Klar SA de CV, Maximo Pay SAC, MEXARREND S.A.P.I. DE C.V., Neon Pagamentos S.A., Nu Holdings Ltd., Rappi Inc., Revolut Ltd., Servicios Broxel SAPI de CV, and UNIVERSO ONLINE SA |
|
Market dynamics |
Parent market analysis, Market growth inducers and obstacles, Fast-growing and slow-growing segment analysis, COVID-19 impact and recovery analysis and future consumer dynamics, Market condition analysis for forecast period |
|
Customization purview |
If our report has not included the data that you are looking for, you can reach out to our analysts and get segments customized. |
1 Executive Summary
- 1.1 Market overview
- Exhibit 01: Executive Summary – Chart on Market Overview
- Exhibit 02: Executive Summary – Data Table on Market Overview
- Exhibit 03: Executive Summary – Chart on Country Market Characteristics
- Exhibit 04: Executive Summary – Chart on Market by Geography
- Exhibit 05: Executive Summary – Chart on Market Segmentation by Component
- Exhibit 06: Executive Summary – Chart on Market Segmentation by Type
- Exhibit 07: Executive Summary – Chart on Market Segmentation by End-user
- Exhibit 08: Executive Summary – Chart on Incremental Growth
- Exhibit 09: Executive Summary – Data Table on Incremental Growth
- Exhibit 10: Executive Summary – Chart on Vendor Market Positioning
2 Market Landscape
- 2.1 Market ecosystem
- Exhibit 11: Parent market
- Exhibit 12: Market Characteristics
3 Market Sizing
- 3.1 Market definition
- Exhibit 13: Offerings of vendors included in the market definition
- 3.2 Market segment analysis
- Exhibit 14: Market segments
- 3.3 Market size 2022
- 3.4 Market outlook: Forecast for 2022-2027
- Exhibit 15: Chart on Latin America – Market size and forecast 2022-2027 ($ million)
- Exhibit 16: Data Table on Regional – Market size and forecast 2022-2027 ($ million)
- Exhibit 17: Chart on Latin America: Year-over-year growth 2022-2027 (%)
- Exhibit 18: Data Table on Regional – Market size and forecast 2022-2027 ($ million)
4 Historic Market Size
- 4.1 Banking as a Service market in Latin America 2017 – 2021
- Exhibit 19: Historic Market Size – Data Table on Banking as a Service market in Latin America 2017 – 2021 ($ million)
- 4.2 Component Segment Analysis 2017 – 2021
- Exhibit 20: Historic Market Size – Component Segment 2017 – 2021 ($ million)
- 4.3 Type Segment Analysis 2017 – 2021
- Exhibit 21: Historic Market Size – Type Segment 2017 – 2021 ($ million)
- 4.4 End-user Segment Analysis 2017 – 2021
- Exhibit 22: Historic Market Size – End-user Segment 2017 – 2021 ($ million)
- 4.5 Country Segment Analysis 2017 – 2021
- Exhibit 23: Historic Market Size – Country Segment 2017 – 2021 ($ million)
5 Five Forces Analysis
- 5.1 Five forces summary
- Exhibit 24: Five forces analysis – Comparison between 2022 and 2027
- 5.2 Bargaining power of buyers
- Exhibit 25: Chart on Bargaining power of buyers – Impact of key factors 2022 and 2027
- 5.3 Bargaining power of suppliers
- Exhibit 26: Bargaining power of suppliers – Impact of key factors in 2022 and 2027
- 5.4 Threat of new entrants
- Exhibit 27: Threat of new entrants – Impact of key factors in 2022 and 2027
- 5.5 Threat of substitutes
- Exhibit 28: Threat of substitutes – Impact of key factors in 2022 and 2027
- 5.6 Threat of rivalry
- Exhibit 29: Threat of rivalry – Impact of key factors in 2022 and 2027
- 5.7 Market condition
- Exhibit 30: Chart on Market condition – Five forces 2022 and 2027
6 Market Segmentation by Component
- 6.1 Market segments
- Exhibit 31: Chart on Component – Market share 2022-2027 (%)
- Exhibit 32: Data Table on Component – Market share 2022-2027 (%)
- 6.2 Comparison by Component
- Exhibit 33: Chart on Comparison by Component
- Exhibit 34: Data Table on Comparison by Component
- 6.3 Platform – Market size and forecast 2022-2027
- Exhibit 35: Chart on Platform – Market size and forecast 2022-2027 ($ million)
- Exhibit 36: Data Table on Platform – Market size and forecast 2022-2027 ($ million)
- Exhibit 37: Chart on Platform – Year-over-year growth 2022-2027 (%)
- Exhibit 38: Data Table on Platform – Year-over-year growth 2022-2027 (%)
- 6.4 Services – Market size and forecast 2022-2027
- Exhibit 39: Chart on Services – Market size and forecast 2022-2027 ($ million)
- Exhibit 40: Data Table on Services – Market size and forecast 2022-2027 ($ million)
- Exhibit 41: Chart on Services – Year-over-year growth 2022-2027 (%)
- Exhibit 42: Data Table on Services – Year-over-year growth 2022-2027 (%)
- 6.5 Market opportunity by Component
- Exhibit 43: Market opportunity by Component ($ million)
7 Market Segmentation by Type
- 7.1 Market segments
- Exhibit 44: Chart on Type – Market share 2022-2027 (%)
- Exhibit 45: Data Table on Type – Market share 2022-2027 (%)
- 7.2 Comparison by Type
- Exhibit 46: Chart on Comparison by Type
- Exhibit 47: Data Table on Comparison by Type
- 7.3 Cloud-based – Market size and forecast 2022-2027
- Exhibit 48: Chart on Cloud-based – Market size and forecast 2022-2027 ($ million)
- Exhibit 49: Data Table on Cloud-based – Market size and forecast 2022-2027 ($ million)
- Exhibit 50: Chart on Cloud-based – Year-over-year growth 2022-2027 (%)
- Exhibit 51: Data Table on Cloud-based – Year-over-year growth 2022-2027 (%)
- 7.4 API-based – Market size and forecast 2022-2027
- Exhibit 52: Chart on API-based – Market size and forecast 2022-2027 ($ million)
- Exhibit 53: Data Table on API-based – Market size and forecast 2022-2027 ($ million)
- Exhibit 54: Chart on API-based – Year-over-year growth 2022-2027 (%)
- Exhibit 55: Data Table on API-based – Year-over-year growth 2022-2027 (%)
- 7.5 Market opportunity by Type
- Exhibit 56: Market opportunity by Type ($ million)
8 Market Segmentation by End-user
- 8.1 Market segments
- Exhibit 57: Chart on End-user – Market share 2022-2027 (%)
- Exhibit 58: Data Table on End-user – Market share 2022-2027 (%)
- 8.2 Comparison by End-user
- Exhibit 59: Chart on Comparison by End-user
- Exhibit 60: Data Table on Comparison by End-user
- 8.3 Large enterprise – Market size and forecast 2022-2027
- Exhibit 61: Chart on Large enterprise – Market size and forecast 2022-2027 ($ million)
- Exhibit 62: Data Table on Large enterprise – Market size and forecast 2022-2027 ($ million)
- Exhibit 63: Chart on Large enterprise – Year-over-year growth 2022-2027 (%)
- Exhibit 64: Data Table on Large enterprise – Year-over-year growth 2022-2027 (%)
- 8.4 Small and medium enterprise – Market size and forecast 2022-2027
- Exhibit 65: Chart on Small and medium enterprise – Market size and forecast 2022-2027 ($ million)
- Exhibit 66: Data Table on Small and medium enterprise – Market size and forecast 2022-2027 ($ million)
- Exhibit 67: Chart on Small and medium enterprise – Year-over-year growth 2022-2027 (%)
- Exhibit 68: Data Table on Small and medium enterprise – Year-over-year growth 2022-2027 (%)
- 8.5 Market opportunity by End-user
- Exhibit 69: Market opportunity by End-user ($ million)
9 Customer Landscape
- 9.1 Customer landscape overview
- Exhibit 70: Analysis of price sensitivity, lifecycle, customer purchase basket, adoption rates, and purchase criteria
10 Geographic Landscape
- 10.1 Geographic segmentation
- Exhibit 71: Chart on Market share by geography – 2022-2027 (%)
- Exhibit 72: Data Table on Market share by geography – 2022-2027 (%)
- 10.2 Geographic comparison
- Exhibit 73: Chart on Geographic comparison
- Exhibit 74: Data Table on Geographic comparison
- 10.3 Brazil – Market size and forecast 2022-2027
- Exhibit 75: Chart on Brazil – Market size and forecast 2022-2027 ($ million)
- Exhibit 76: Data Table on Brazil – Market size and forecast 2022-2027 ($ million)
- Exhibit 77: Chart on Brazil – Year-over-year growth 2022-2027 (%)
- Exhibit 78: Data Table on Brazil – Year-over-year growth 2022-2027 (%)
- 10.4 Mexico – Market size and forecast 2022-2027
- Exhibit 79: Chart on Mexico – Market size and forecast 2022-2027 ($ million)
- Exhibit 80: Data Table on Mexico – Market size and forecast 2022-2027 ($ million)
- Exhibit 81: Chart on Mexico – Year-over-year growth 2022-2027 (%)
- Exhibit 82: Data Table on Mexico – Year-over-year growth 2022-2027 (%)
- 10.5 Colombia – Market size and forecast 2022-2027
- Exhibit 83: Chart on Colombia – Market size and forecast 2022-2027 ($ million)
- Exhibit 84: Data Table on Colombia – Market size and forecast 2022-2027 ($ million)
- Exhibit 85: Chart on Colombia – Year-over-year growth 2022-2027 (%)
- Exhibit 86: Data Table on Colombia – Year-over-year growth 2022-2027 (%)
- 10.6 Argentina – Market size and forecast 2022-2027
- Exhibit 87: Chart on Argentina – Market size and forecast 2022-2027 ($ million)
- Exhibit 88: Data Table on Argentina – Market size and forecast 2022-2027 ($ million)
- Exhibit 89: Chart on Argentina – Year-over-year growth 2022-2027 (%)
- Exhibit 90: Data Table on Argentina – Year-over-year growth 2022-2027 (%)
- 10.7 Rest of Latin America – Market size and forecast 2022-2027
- Exhibit 91: Chart on Rest of Latin America – Market size and forecast 2022-2027 ($ million)
- Exhibit 92: Data Table on Rest of Latin America – Market size and forecast 2022-2027 ($ million)
- Exhibit 93: Chart on Rest of Latin America – Year-over-year growth 2022-2027 (%)
- Exhibit 94: Data Table on Rest of Latin America – Year-over-year growth 2022-2027 (%)
- 10.8 Market opportunity by geography
- Exhibit 95: Market opportunity by geography ($ million)
11 Drivers, Challenges, and Trends
- 11.1 Market drivers
- 11.2 Market challenges
- 11.3 Impact of drivers and challenges
- Exhibit 96: Impact of drivers and challenges in 2022 and 2027
- 11.4 Market trends
12 Vendor Landscape
- 12.1 Overview
- 12.2 Vendor landscape
- Exhibit 97: Overview on Criticality of inputs and Factors of differentiation
- 12.3 Landscape disruption
- Exhibit 98: Overview on factors of disruption
- 12.4 Industry risks
- Exhibit 99: Impact of key risks on business
13 Vendor Analysis
- 13.1 Vendors covered
- Exhibit 100: Vendors covered
- 13.2 Market positioning of vendors
- Exhibit 101: Matrix on vendor position and classification
- 13.3 Alau Technology SAU
- Exhibit 102: Alau Technology SAU – Overview
- Exhibit 103: Alau Technology SAU – Product / Service
- Exhibit 104: Alau Technology SAU – Key offerings
- 13.4 BICECORP SA
- Exhibit 105: BICECORP SA – Overview
- Exhibit 106: BICECORP SA – Product / Service
- Exhibit 107: BICECORP SA – Key offerings
- 13.5 Cuenca Tecnología Financiera SA de CV
- Exhibit 108: Cuenca Tecnología Financiera SA de CV – Overview
- Exhibit 109: Cuenca Tecnología Financiera SA de CV – Product / Service
- Exhibit 110: Cuenca Tecnología Financiera SA de CV – Key offerings
- 13.6 EBANX
- Exhibit 111: EBANX – Overview
- Exhibit 112: EBANX – Product / Service
- Exhibit 113: EBANX – Key offerings
- 13.7 GIRE SA
- Exhibit 114: GIRE SA – Overview
- Exhibit 115: GIRE SA – Product / Service
- Exhibit 116: GIRE SA – Key offerings
- 13.8 Inteligencia en Finanzas S.A.P.I. de C.V.
- Exhibit 117: Inteligencia en Finanzas S.A.P.I. de C.V. – Overview
- Exhibit 118: Inteligencia en Finanzas S.A.P.I. de C.V. – Product / Service
- Exhibit 119: Inteligencia en Finanzas S.A.P.I. de C.V. – Key offerings
- 13.9 Klar SA de CV
- Exhibit 120: Klar SA de CV – Overview
- Exhibit 121: Klar SA de CV – Product / Service
- Exhibit 122: Klar SA de CV – Key offerings
- 13.10 Maximo Pay SAC
- Exhibit 123: Maximo Pay SAC – Overview
- Exhibit 124: Maximo Pay SAC – Product / Service
- Exhibit 125: Maximo Pay SAC – Key offerings
- 13.11 MEXARREND S.A.P.I. DE C.V.
- Exhibit 126: MEXARREND S.A.P.I. DE C.V. – Overview
- Exhibit 127: MEXARREND S.A.P.I. DE C.V. – Product / Service
- Exhibit 128: MEXARREND S.A.P.I. DE C.V. – Key offerings
- 13.12 Neon Pagamentos S.A.
- Exhibit 129: Neon Pagamentos S.A. – Overview
- Exhibit 130: Neon Pagamentos S.A. – Product / Service
- Exhibit 131: Neon Pagamentos S.A. – Key offerings
- 13.13 Nu Holdings Ltd.
- Exhibit 132: Nu Holdings Ltd. – Overview
- Exhibit 133: Nu Holdings Ltd. – Product / Service
- Exhibit 134: Nu Holdings Ltd. – Key offerings
- 13.14 Rappi Inc.
- Exhibit 135: Rappi Inc. – Overview
- Exhibit 136: Rappi Inc. – Product / Service
- Exhibit 137: Rappi Inc. – Key offerings
- 13.15 Revolut Ltd.
- Exhibit 138: Revolut Ltd. – Overview
- Exhibit 139: Revolut Ltd. – Product / Service
- Exhibit 140: Revolut Ltd. – Key offerings
- 13.16 Servicios Broxel SAPI de CV
- Exhibit 141: Servicios Broxel SAPI de CV – Overview
- Exhibit 142: Servicios Broxel SAPI de CV – Product / Service
- Exhibit 143: Servicios Broxel SAPI de CV – Key offerings
- 13.17 UNIVERSO ONLINE SA
- Exhibit 144: UNIVERSO ONLINE SA – Overview
- Exhibit 145: UNIVERSO ONLINE SA – Product / Service
- Exhibit 146: UNIVERSO ONLINE SA – Key offerings
14 Appendix
- 14.1 Scope of the report
- 14.2 Inclusions and exclusions checklist
- Exhibit 147: Inclusions checklist
- Exhibit 148: Exclusions checklist
- 14.3 Currency conversion rates for US$
- Exhibit 149: Currency conversion rates for US$
- 14.4 Research methodology
- Exhibit 150: Research methodology
- Exhibit 151: Validation techniques employed for market sizing
- Exhibit 152: Information sources
- 14.5 List of abbreviations
- Exhibit 153: List of abbreviations
About Us
Technavio is a leading global technology research and advisory company. Their research and analysis focuses on emerging market trends and provides actionable insights to help businesses identify market opportunities and develop effective strategies to optimize their market positions. With over 500 specialized analysts, Technavio’s report library consists of more than 17,000 reports and counting, covering 800 technologies, spanning across 50 countries. Their client base consists of enterprises of all sizes, including more than 100 Fortune 500 companies. This growing client base relies on Technavio’s comprehensive coverage, extensive research, and actionable market insights to identify opportunities in existing and potential markets and assess their competitive positions within changing market scenarios.
Contact
Technavio Research
Jesse Maida
Media & Marketing Executive
US: +1 844 364 1100
UK: +44 203 893 3200
Email: media@technavio.com
Website: www.technavio.com/
![]()
![]() View original content to download multimedia:https://www.prnewswire.com/news-releases/banking-as-a-service-market-size-in-latin-america-to-grow-by-usd-4-309-74-million-from-2022-to-2027-growth-driven-by-the-increasing-adoption-of-baas-solutions-by-end-users–technavio-301834434.html
View original content to download multimedia:https://www.prnewswire.com/news-releases/banking-as-a-service-market-size-in-latin-america-to-grow-by-usd-4-309-74-million-from-2022-to-2027-growth-driven-by-the-increasing-adoption-of-baas-solutions-by-end-users–technavio-301834434.html
SOURCE Technavio
