NEW YORK, June 2, 2023 /PRNewswire/ — The Interactive Flat Panels market is segmented by Application (education sector and the corporate sector), type (LCD flat panels, interactive UHD/4K flat panels, and HD flat panels.) and Geography (North America, APAC, Europe, MEA, and South America).

Discover market potential and make informed business decisions based on qualitative and quantitative evidence highlighted in Technavio reports Download the PDF Sample Report
Regional Market Outlook
The availability of devices like e book readers, tablets and laptops, coupled with Internet connectivity, has resulted in widespread adoption of digital classroom and e-learning. Consequently, more educational institutions are upgrading their hardware infrastructure to accommodate advanced applications and technologies like interactive flat panels.
Additionally, the US represents the largest tech market globally, accounting for 30% of the market. The thriving tech industry and the region’s education sector will drive the expansion of the interactive flat panel market in North America.
View the sample report for more key highlights on the regional market share
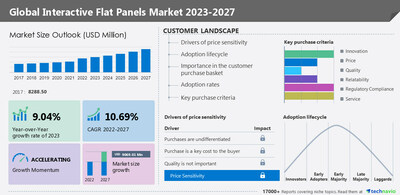
Global Market Outlook
The Interactive Flat Panels market size is expected to increase by USD 9,069.01 million from 2022 to 2027, expediting at a CAGR of 10.69% during the forecast period. The interactive panel market is witnessing major trends driven by new technological advancements. The global interactive flat panel market is divided into different regions based on geography, including North America, APAC (Asia-Pacific), Europe, Middle East, Africa (MEA), and South America.
Moreover, the increasing popularity of active learning techniques such as gamification and video tutorials has led to a high demand for learning management systems (LMS) and classroom management systems (CMS). These factors are poised to contribute to the growth of the global market throughout the forecast period.
Latest Drivers and Challenges Impacting the Interactive Flat Panel smarket
Interactive Flat Panels Market Drivers
- Growth of e-learning: Content for e-learning can be sourced from various outlets, following the content creation, there is a need for software platforms and content management solutions. In the education industry content management development firms are witnessing vast opportunity in e-learning market, driven by growing demand from schools and universities.
- Increasing use of advanced technologies in education sector
- Adoption of interactive flat panels in corporate and government sectors
Interactive Flat Panels Market Challenges
- High cost of interactive flat panels: The pricing of interactive flat panels is influenced by several factors, including the type of technology, display specifications, and application focus (e.g., corporate or education sector). It is essential to consider the technical specification that allign with the end-users’ requirements when designing an interactive flat panel system. These factors collectively contribute to higher cost of interactive flat panel system.
- Threat from alternative products
- Challenges in implementation
Explore the evolving Vendor Landscape
Some of the Interactive Flat Panels market vendors are:
- BenQ Corp. – The company offers a wide range of projectors for business, residential, and education applications. Some of the categories include home projectors, business projectors, interactive classroom projectors, and 4K Home projectors among others.
- Hitachi Ltd. – The company offers interactive flat panel products such as HILU65203 and HILS65204.
- Koninklijke Philips NV – The company offers interactive flat panel products such as 242B9T and 55BDL6051C.
- LG Electronics Inc. – The company offers interactive flat panel products such as 49TA3E-B, TR3DJ Series, and 75TC3D.
- NEC Corp. – The company offers interactive flat panel products such as NEC MultiSync ME551 IR, NEC MultiSync ME501 IR, and NEC MultiSync ME431 IR.
Request a sample today to explore the offerings of vendors and discover how they can benefit your business. – View Sample Report in minutes
Key benefits of the report:
- This study presents the analytical depiction of the Interactive Flat Panels market along with the current trends and future estimations to determine the imminent investment pockets.
- The report presents information related to key drivers, restraints, and opportunities along with detailed analysis of the flat panels market share.
- The current market is quantitatively analyzed to highlight the Interactive Flat Panels market growth scenario.
- The report provides a detailed Interactive Flat Panels market analysis depending on competitive intensity and how the competition will take shape in coming years.
Register for a free trial today and gain instant access to 17,000+ market research reports.
Technavio’s SUBSCRIPTION platform
Related Reports
Solar Panels Market – The solar panels market size is estimated to grow at a CAGR of 7.87% between 2022 and 2027. The market size is forecast to increase by USD 50.08 billion.
3D Display Market – The 3D display market is estimated to grow at a CAGR of 17.85% between 2022 and 2027. The market size is forecast to increase by USD 92.41 billion.
|
Interactive Flat Panels Market Scope |
|
|
Report Coverage |
Details |
|
Page number |
172 |
|
Base year |
2022 |
|
Historic period |
2017-2021 |
|
Forecast period |
2023-2027 |
|
Growth momentum & CAGR |
Accelerate at a CAGR of 10.69% |
|
Market growth 2023-2027 |
USD 9069.01 million |
|
Market structure |
Fragmented |
|
YoY growth 2022-2023 (%) |
9.04 |
|
Regional analysis |
North America, APAC, Europe, Middle East and Africa, and South America |
|
Performing market contribution |
North America at 42% |
|
Key countries |
US, China, Japan, Germany, and UK |
|
Competitive landscape |
Leading Vendors, Market Positioning of Vendors, Competitive Strategies, and Industry Risks |
|
Key companies profiled |
Baanto International Ltd., BenQ Corp., Boxlight Corp, Crystal Display Systems Ltd., Elo Touch Solutions Inc., Hangzhou Hikvision Digital, Hitachi Ltd., Horizon Display Inc., Koninklijke Philips NV, LG Electronics Inc., NEC Corp., Panasonic Holdings Corp., Planar Systems Inc., Promethean Ltd., Samsung Electronics Co. Ltd., Sharp Corp., SMART Technologies ULC, ViewSonic Corp., Wishtel Private Ltd., and Accuview Inc |
|
Market dynamics |
Parent Market Analysis; Market growth inducers and obstacles; Fast-growing and slow-growing segment analysis for the forecast period |
|
Customization purview |
If our report has not included the data that you are looking for, you can reach out to our analysts and get segments customized. |
|
Customization purview |
If our report has not included the data that you are looking for, you can reach out to our analysts and get segments customized. |
Don’t miss out on critical insights purchase our report now
1 Executive Summary
- 1.1 Market overview
- Exhibit 01: Executive Summary – Chart on Market Overview
- Exhibit 02: Executive Summary – Data Table on Market Overview
- Exhibit 03: Executive Summary – Chart on Global Market Characteristics
- Exhibit 04: Executive Summary – Chart on Market by Geography
- Exhibit 05: Executive Summary – Chart on Market Segmentation by Application
- Exhibit 06: Executive Summary – Chart on Market Segmentation by Display Type
- Exhibit 07: Executive Summary – Chart on Incremental Growth
- Exhibit 08: Executive Summary – Data Table on Incremental Growth
- Exhibit 09: Executive Summary – Chart on Vendor Market Positioning
2 Market Landscape
- 2.1 Market ecosystem
- Exhibit 10: Parent market
- Exhibit 11: Market Characteristics
3 Market Sizing
- 3.1 Market definition
- Exhibit 12: Offerings of vendors included in the market definition
- 3.2 Market segment analysis
- Exhibit 13: Market segments
- 3.3 Market size 2022
- 3.4 Market outlook: Forecast for 2022-2027
- Exhibit 14: Chart on Global – Market size and forecast 2022-2027 ($ million)
- Exhibit 15: Data Table on Global – Market size and forecast 2022-2027 ($ million)
- Exhibit 16: Chart on Global Market: Year-over-year growth 2022-2027 (%)
- Exhibit 17: Data Table on Global Market: Year-over-year growth 2022-2027 (%)
4 Historic Market Size
- 4.1 Global interactive flat panels market 2017 – 2021
- Exhibit 18: Historic Market Size – Data Table on Global interactive flat panels market 2017 – 2021 ($ million)
- 4.2 Application Segment Analysis 2017 – 2021
- Exhibit 19: Historic Market Size – Application Segment 2017 – 2021 ($ million)
- 4.3 Display type Segment Analysis 2017 – 2021
- Exhibit 20: Historic Market Size – Display type Segment 2017 – 2021 ($ million)
- 4.4 Geography Segment Analysis 2017 – 2021
- Exhibit 21: Historic Market Size – Geography Segment 2017 – 2021 ($ million)
- 4.5 Country Segment Analysis 2017 – 2021
- Exhibit 22: Historic Market Size – Country Segment 2017 – 2021 ($ million)
5 Five Forces Analysis
- 5.1 Five forces summary
- Exhibit 23: Five forces analysis – Comparison between 2022 and 2027
- 5.2 Bargaining power of buyers
- Exhibit 24: Chart on Bargaining power of buyers – Impact of key factors 2022 and 2027
- 5.3 Bargaining power of suppliers
- Exhibit 25: Bargaining power of suppliers – Impact of key factors in 2022 and 2027
- 5.4 Threat of new entrants
- Exhibit 26: Threat of new entrants – Impact of key factors in 2022 and 2027
- 5.5 Threat of substitutes
- Exhibit 27: Threat of substitutes – Impact of key factors in 2022 and 2027
- 5.6 Threat of rivalry
- Exhibit 28: Threat of rivalry – Impact of key factors in 2022 and 2027
- 5.7 Market condition
- Exhibit 29: Chart on Market condition – Five forces 2022 and 2027
6 Market Segmentation by Application
- 6.1 Market segments
- Exhibit 30: Chart on Application – Market share 2022-2027 (%)
- Exhibit 31: Data Table on Application – Market share 2022-2027 (%)
- 6.2 Comparison by Application
- Exhibit 32: Chart on Comparison by Application
- Exhibit 33: Data Table on Comparison by Application
- 6.3 Education sector – Market size and forecast 2022-2027
- Exhibit 34: Chart on Education sector – Market size and forecast 2022-2027 ($ million)
- Exhibit 35: Data Table on Education sector – Market size and forecast 2022-2027 ($ million)
- Exhibit 36: Chart on Education sector – Year-over-year growth 2022-2027 (%)
- Exhibit 37: Data Table on Education sector – Year-over-year growth 2022-2027 (%)
- 6.4 Corporate sector – Market size and forecast 2022-2027
- Exhibit 38: Chart on Corporate sector – Market size and forecast 2022-2027 ($ million)
- Exhibit 39: Data Table on Corporate sector – Market size and forecast 2022-2027 ($ million)
- Exhibit 40: Chart on Corporate sector – Year-over-year growth 2022-2027 (%)
- Exhibit 41: Data Table on Corporate sector – Year-over-year growth 2022-2027 (%)
- 6.5 Market opportunity by Application
- Exhibit 42: Market opportunity by Application ($ million)
7 Market Segmentation by Display Type
- 7.1 Market segments
- Exhibit 43: Chart on Display Type – Market share 2022-2027 (%)
- Exhibit 44: Data Table on Display Type – Market share 2022-2027 (%)
- 7.2 Comparison by Display Type
- Exhibit 45: Chart on Comparison by Display Type
- Exhibit 46: Data Table on Comparison by Display Type
- 7.3 Plasma and LCD flat panels – Market size and forecast 2022-2027
- Exhibit 47: Chart on Plasma and LCD flat panels – Market size and forecast 2022-2027 ($ million)
- Exhibit 48: Data Table on Plasma and LCD flat panels – Market size and forecast 2022-2027 ($ million)
- Exhibit 49: Chart on Plasma and LCD flat panels – Year-over-year growth 2022-2027 (%)
- Exhibit 50: Data Table on Plasma and LCD flat panels – Year-over-year growth 2022-2027 (%)
- 7.4 Interactive UHD/4K flat panels – Market size and forecast 2022-2027
- Exhibit 51: Chart on Interactive UHD/4K flat panels – Market size and forecast 2022-2027 ($ million)
- Exhibit 52: Data Table on Interactive UHD/4K flat panels – Market size and forecast 2022-2027 ($ million)
- Exhibit 53: Chart on Interactive UHD/4K flat panels – Year-over-year growth 2022-2027 (%)
- Exhibit 54: Data Table on Interactive UHD/4K flat panels – Year-over-year growth 2022-2027 (%)
- 7.5 HD flat panels – Market size and forecast 2022-2027
- Exhibit 55: Chart on HD flat panels – Market size and forecast 2022-2027 ($ million)
- Exhibit 56: Data Table on HD flat panels – Market size and forecast 2022-2027 ($ million)
- Exhibit 57: Chart on HD flat panels – Year-over-year growth 2022-2027 (%)
- Exhibit 58: Data Table on HD flat panels – Year-over-year growth 2022-2027 (%)
- 7.6 Market opportunity by Display Type
- Exhibit 59: Market opportunity by Display Type ($ million)
8 Customer Landscape
- 8.1 Customer landscape overview
- Exhibit 60: Analysis of price sensitivity, lifecycle, customer purchase basket, adoption rates, and purchase criteria
9 Geographic Landscape
- 9.1 Geographic segmentation
- Exhibit 61: Chart on Market share by geography 2022-2027 (%)
- Exhibit 62: Data Table on Market share by geography 2022-2027 (%)
- 9.2 Geographic comparison
- Exhibit 63: Chart on Geographic comparison
- Exhibit 64: Data Table on Geographic comparison
- 9.3 North America – Market size and forecast 2022-2027
- Exhibit 65: Chart on North America – Market size and forecast 2022-2027 ($ million)
- Exhibit 66: Data Table on North America – Market size and forecast 2022-2027 ($ million)
- Exhibit 67: Chart on North America – Year-over-year growth 2022-2027 (%)
- Exhibit 68: Data Table on North America – Year-over-year growth 2022-2027 (%)
- 9.4 APAC – Market size and forecast 2022-2027
- Exhibit 69: Chart on APAC – Market size and forecast 2022-2027 ($ million)
- Exhibit 70: Data Table on APAC – Market size and forecast 2022-2027 ($ million)
- Exhibit 71: Chart on APAC – Year-over-year growth 2022-2027 (%)
- Exhibit 72: Data Table on APAC – Year-over-year growth 2022-2027 (%)
- 9.5 Europe – Market size and forecast 2022-2027
- Exhibit 73: Chart on Europe – Market size and forecast 2022-2027 ($ million)
- Exhibit 74: Data Table on Europe – Market size and forecast 2022-2027 ($ million)
- Exhibit 75: Chart on Europe – Year-over-year growth 2022-2027 (%)
- Exhibit 76: Data Table on Europe – Year-over-year growth 2022-2027 (%)
- 9.6 Middle East and Africa – Market size and forecast 2022-2027
- Exhibit 77: Chart on Middle East and Africa – Market size and forecast 2022-2027 ($ million)
- Exhibit 78: Data Table on Middle East and Africa – Market size and forecast 2022-2027 ($ million)
- Exhibit 79: Chart on Middle East and Africa – Year-over-year growth 2022-2027 (%)
- Exhibit 80: Data Table on Middle East and Africa – Year-over-year growth 2022-2027 (%)
- 9.7 South America – Market size and forecast 2022-2027
- Exhibit 81: Chart on South America – Market size and forecast 2022-2027 ($ million)
- Exhibit 82: Data Table on South America – Market size and forecast 2022-2027 ($ million)
- Exhibit 83: Chart on South America – Year-over-year growth 2022-2027 (%)
- Exhibit 84: Data Table on South America – Year-over-year growth 2022-2027 (%)
- 9.8 US – Market size and forecast 2022-2027
- Exhibit 85: Chart on US – Market size and forecast 2022-2027 ($ million)
- Exhibit 86: Data Table on US – Market size and forecast 2022-2027 ($ million)
- Exhibit 87: Chart on US – Year-over-year growth 2022-2027 (%)
- Exhibit 88: Data Table on US – Year-over-year growth 2022-2027 (%)
- 9.9 China – Market size and forecast 2022-2027
- Exhibit 89: Chart on China – Market size and forecast 2022-2027 ($ million)
- Exhibit 90: Data Table on China – Market size and forecast 2022-2027 ($ million)
- Exhibit 91: Chart on China – Year-over-year growth 2022-2027 (%)
- Exhibit 92: Data Table on China – Year-over-year growth 2022-2027 (%)
- 9.10 Germany – Market size and forecast 2022-2027
- Exhibit 93: Chart on Germany – Market size and forecast 2022-2027 ($ million)
- Exhibit 94: Data Table on Germany – Market size and forecast 2022-2027 ($ million)
- Exhibit 95: Chart on Germany – Year-over-year growth 2022-2027 (%)
- Exhibit 96: Data Table on Germany – Year-over-year growth 2022-2027 (%)
- 9.11 Japan – Market size and forecast 2022-2027
- Exhibit 97: Chart on Japan – Market size and forecast 2022-2027 ($ million)
- Exhibit 98: Data Table on Japan – Market size and forecast 2022-2027 ($ million)
- Exhibit 99: Chart on Japan – Year-over-year growth 2022-2027 (%)
- Exhibit 100: Data Table on Japan – Year-over-year growth 2022-2027 (%)
- 9.12 UK – Market size and forecast 2022-2027
- Exhibit 101: Chart on UK – Market size and forecast 2022-2027 ($ million)
- Exhibit 102: Data Table on UK – Market size and forecast 2022-2027 ($ million)
- Exhibit 103: Chart on UK – Year-over-year growth 2022-2027 (%)
- Exhibit 104: Data Table on UK – Year-over-year growth 2022-2027 (%)
- 9.13 Market opportunity by geography
- Exhibit 105: Market opportunity by geography ($ million)
10 Drivers, Challenges, and Trends
- 10.1 Market drivers
- 10.2 Market challenges
- 10.3 Impact of drivers and challenges
- Exhibit 106: Impact of drivers and challenges in 2022 and 2027
- 10.4 Market trends
11 Vendor Landscape
- 11.1 Overview
- 11.2 Vendor landscape
- Exhibit 107: Overview on Criticality of inputs and Factors of differentiation
- 11.3 Landscape disruption
- Exhibit 108: Overview on factors of disruption
- 11.4 Industry risks
- Exhibit 109: Impact of key risks on business
12 Vendor Analysis
- 12.1 Vendors covered
- Exhibit 110: Vendors covered
- 12.2 Market positioning of vendors
- Exhibit 111: Matrix on vendor position and classification
- 12.3 Accuview Inc
- Exhibit 112: Accuview Inc – Overview
- Exhibit 113: Accuview Inc – Product / Service
- Exhibit 114: Accuview Inc – Key offerings
- 12.4 BenQ Corp.
- Exhibit 115: BenQ Corp. – Overview
- Exhibit 116: BenQ Corp. – Product / Service
- Exhibit 117: BenQ Corp. – Key offerings
- 12.5 Boxlight Corp
- Exhibit 118: Boxlight Corp – Overview
- Exhibit 119: Boxlight Corp – Business segments
- Exhibit 120: Boxlight Corp – Key offerings
- Exhibit 121: Boxlight Corp – Segment focus
- 12.6 Elo Touch Solutions Inc.
- Exhibit 122: Elo Touch Solutions Inc. – Overview
- Exhibit 123: Elo Touch Solutions Inc. – Product / Service
- Exhibit 124: Elo Touch Solutions Inc. – Key offerings
- 12.7 Hangzhou Hikvision Digital
- Exhibit 125: Hangzhou Hikvision Digital – Overview
- Exhibit 126: Hangzhou Hikvision Digital – Product / Service
- Exhibit 127: Hangzhou Hikvision Digital – Key offerings
- 12.8 Hitachi Ltd.
- Exhibit 128: Hitachi Ltd. – Overview
- Exhibit 129: Hitachi Ltd. – Business segments
- Exhibit 130: Hitachi Ltd. – Key news
- Exhibit 131: Hitachi Ltd. – Key offerings
- Exhibit 132: Hitachi Ltd. – Segment focus
- 12.9 Koninklijke Philips NV
- Exhibit 133: Koninklijke Philips NV – Overview
- Exhibit 134: Koninklijke Philips NV – Business segments
- Exhibit 135: Koninklijke Philips NV – Key news
- Exhibit 136: Koninklijke Philips NV – Key offerings
- Exhibit 137: Koninklijke Philips NV – Segment focus
- 12.10 LG Electronics Inc.
- Exhibit 138: LG Electronics Inc. – Overview
- Exhibit 139: LG Electronics Inc. – Business segments
- Exhibit 140: LG Electronics Inc. – Key news
- Exhibit 141: LG Electronics Inc. – Key offerings
- Exhibit 142: LG Electronics Inc. – Segment focus
- 12.11 NEC Corp.
- Exhibit 143: NEC Corp. – Overview
- Exhibit 144: NEC Corp. – Business segments
- Exhibit 145: NEC Corp. – Key news
- Exhibit 146: NEC Corp. – Key offerings
- Exhibit 147: NEC Corp. – Segment focus
- 12.12 Panasonic Holdings Corp.
- Exhibit 148: Panasonic Holdings Corp. – Overview
- Exhibit 149: Panasonic Holdings Corp. – Business segments
- Exhibit 150: Panasonic Holdings Corp. – Key news
- Exhibit 151: Panasonic Holdings Corp. – Key offerings
- Exhibit 152: Panasonic Holdings Corp. – Segment focus
- 12.13 Planar Systems Inc.
- Exhibit 153: Planar Systems Inc. – Overview
- Exhibit 154: Planar Systems Inc. – Product / Service
- Exhibit 155: Planar Systems Inc. – Key offerings
- 12.14 Promethean Ltd.
- Exhibit 156: Promethean Ltd. – Overview
- Exhibit 157: Promethean Ltd. – Product / Service
- Exhibit 158: Promethean Ltd. – Key offerings
- 12.15 Samsung Electronics Co. Ltd.
- Exhibit 159: Samsung Electronics Co. Ltd. – Overview
- Exhibit 160: Samsung Electronics Co. Ltd. – Business segments
- Exhibit 161: Samsung Electronics Co. Ltd. – Key news
- Exhibit 162: Samsung Electronics Co. Ltd. – Key offerings
- Exhibit 163: Samsung Electronics Co. Ltd. – Segment focus
- 12.16 Sharp Corp.
- Exhibit 164: Sharp Corp. – Overview
- Exhibit 165: Sharp Corp. – Business segments
- Exhibit 166: Sharp Corp. – Key news
- Exhibit 167: Sharp Corp. – Key offerings
- Exhibit 168: Sharp Corp. – Segment focus
- 12.17 ViewSonic Corp.
- Exhibit 169: ViewSonic Corp. – Overview
- Exhibit 170: ViewSonic Corp. – Product / Service
- Exhibit 171: ViewSonic Corp. – Key offerings
13 Appendix
- 13.1 Scope of the report
- 13.2 Inclusions and exclusions checklist
- Exhibit 172: Inclusions checklist
- Exhibit 173: Exclusions checklist
- 13.3 Currency conversion rates for US$
- Exhibit 174: Currency conversion rates for US$
- 13.4 Research methodology
- Exhibit 175: Research methodology
- Exhibit 176: Validation techniques employed for market sizing
- Exhibit 177: Information sources
- 13.5 List of abbreviations
- Exhibit 178: List of abbreviations
About Us
Technavio is a leading global technology research and advisory company. Their research and analysis focus on emerging market trends and provide actionable insights to help businesses identify market opportunities and develop effective strategies to optimize their market positions. With over 500 specialized analysts, Technavio’s report library consists of more than 17,000 reports and counting, covering 800 technologies, spanning across 50 countries. Their client base consists of enterprises of all sizes, including more than 100 Fortune 500 companies. This growing client base relies on Technavio’s comprehensive coverage, extensive research, and actionable market insights to identify opportunities in existing and potential markets and assess their competitive positions within changing market scenarios.
Contact
Technavio Research
Jesse Maida
Media & Marketing Executive
US: +1 844 364 1100
UK: +44 203 893 3200
Email: media@technavio.com
Website: www.technavio.com/
![]()
![]() View original content to download multimedia:https://www.prnewswire.com/news-releases/interactive-flat-panels-market-2023-2027-segmentation-by-application-type-and-geography-cagr-accelerating-at-10-69-by-2027–technavio-301840430.html
View original content to download multimedia:https://www.prnewswire.com/news-releases/interactive-flat-panels-market-2023-2027-segmentation-by-application-type-and-geography-cagr-accelerating-at-10-69-by-2027–technavio-301840430.html
SOURCE Technavio
