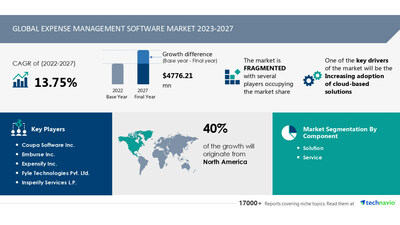
NEW YORK, June 1, 2023 /PRNewswire/ — The global expense management software market size is estimated to increase by USD 4,776.21 million from 2022 to 2027. The market’s growth momentum will progress at a CAGR of 13.75% during the forecast period. Increasing adoption of cloud-based solutions notably drives the expense management software market growth. Cloud-based expense management software solutions are typically less expensive than traditional on-premises solutions because, unlike the latter, there is no need to purchase expensive hardware or software licenses. They also improve scalability, as companies can easily scale up or down their software usage as their needs change. Moreover, cloud-based expense management software provides real-time visibility into expenses, allowing organizations to track expenses incurred and quickly look for issues and discrepancies. Hence, such factors drive market growth during the forecast period. Discover some insights on market size historic period (2017 to 2021) and Forecast 2023-2027 before buying the full report –Request a sample report

Expense management software market – Vendor Analysis
Vendor Landscape – The global expense management software market is fragmented, with the presence of several global as well as regional vendors. A few prominent vendors that offer expense management software in the market are Coupa Software Inc., Emburse Inc., Expensify Inc., Fyle Technologies Pvt. Ltd., Insperity Services L.P., International Business Machines Corp., Intuit Inc., ITILITE, Koch Industries Inc., Oracle Corp., Sage Group Plc, SAP SE, Sodexo SA, The Access Group, VA Tech Ventures Pvt. Ltd., Webexpenses Pty Ltd., Workday Inc., Xero Ltd., Zaggle Prepaid Ocean Services Pvt. Ltd., and Zoho Corp. Pvt. Ltd. and others.
What’s New? –
- Special coverage on the Russia–Ukraine war; global inflation; recovery analysis from COVID-19; supply chain disruptions, global trade tensions; and risk of recession
- Global competitiveness and key competitor positions
- Market presence across multiple geographical footprints – Strong/Active/Niche/Trivial – Buy the report!
Vendor Offerings –
- Coupa Software Inc. – The company offers a Coupa Expenses datasheet that manages travel expenses, purchase orders, supplier records, and budget recorders.
- Expensify Inc. – The company offers an Expensify management application for tracking expenses, scanning receipts, submitting expense reports, paying bills, generating vendor invoices, collecting payments, tracking mileage, and planning trips.
- Insperity Services L.P. – The company offers Automated expense reporting with automatic financial data, tax management, and employee accountability.
- For details on the vendor and their offerings – Request a sample report
Expense Management Software Market – Segmentation Assessment
Segment Overview
Technavio has segmented the market based on components (solution and service), applications (large enterprises and SMEs), and geography (North America, Europe, APAC, South America, and Middle East and Africa).
- The market share growth by the solution segment will be significant for overall market growth during the forecast period. A wide variety of software solutions, which include expenditure reporting software, travel and expense management software, invoice management software, and others, are included in the solution segment of the market. Also, employees can submit expense reports online using expense reporting software that also automates the approval process, and by automating invoice processing and payment, invoice management software enables businesses to process their invoices. Hence, the solutions segment is expected to drive the growth of the market during the forecast period.
Geography Overview
By geography, the global expense management software market is segmented into North America, Europe, APAC, South America, and Middle East and Africa. The report provides actionable insights and estimates the contribution of all regions to the growth of the global expense management software market.
- North America is estimated to account for 40% of the global market growth during the forecast period. The regional market is expected to grow as expense management software is increasingly adopted by companies from various industries such as banking, financial services, and insurance (BFSI). Furthermore, businesses in North America implement expense management software primarily to simplify the reimbursement process. Moreover, while various businesses are embracing mobile apps, the region has SAP SE, Zaggle Prepaid Ocean Services Pvt. Ltd., Emburse Inc., and Sage Group Plc. SAP SE, Zaggle Prepaid Ocean Services Pvt. Ltd., Emburse Inc., and Sage Group Plc offer highly distinctive solutions that improve the customer experience.
For insights on global, regional, and country-level parameters with growth opportunities from 2017 to 2027 – Download a Sample Report
Expense Management Software Market – Market Dynamics
Key Trends –
- Increasing use of Artificial intelligence (AI) and machine learning (ML) in expense management software is an emerging trend in the expense management software market growth. AI and machine learning can help businesses make better decisions by analyzing data and providing insights. They can also help improve the user experience associated with expense management software by providing personalized recommendations and suggestions based on the user’s spending habits.
- Additionally, by automating operations such as expense classification, duplicate expense report detection, and expense highlighting, businesses can save time and reduce errors associated with manual processing. Hence, such trends drive the market growth during the forecast period.
Major challenges –
- Security and privacy concerns associated with expense management software are challenges hindering the expense management software market growth. Applications are used all over the world, and it is important to check the various privacy rules and regulations that apply in different countries.
- In order to avoid data breaches or prevent unauthorized access to sensitive information, companies must ensure that their software providers comply with all relevant data protection laws and have appropriate security measures in place. Hence, the security and privacy concerns in the market will continue to pose major challenges during the forecast period.
What are the key data covered in this Expense Management Software Market report?
- CAGR of the market during the forecast period
- Detailed information on factors that will drive the growth of the expense management software market between 2023 and 2027
- Precise estimation of the size of the expense management software market and its contribution to the market with a focus on the parent market
- Accurate predictions about upcoming trends and changes in consumer behavior
- Growth of theexpense management software market across North America, Europe, APAC, South America, and Middle East and Africa
- A thorough analysis of the market’s competitive landscape and detailed information about vendors
- Comprehensive analysis of factors that will challenge the growth of expense management software market vendors
Gain instant access to 17,000+ market research reports.
Technavio’s SUBSCRIPTION platform
Related Reports:
The claims processing software market size is expected to increase by USD 24.39 billion from 2021 to 2026, and the market’s growth momentum will accelerate at a CAGR of 8.71%. Furthermore, this report extensively covers the claims processing software market segmentation by component (software and services) and geography (North America, Europe, APAC, South America, and the Middle East and Africa). The increasing government regulations on mandatory insurance coverage in developing countries is a key factor driving the global claims processing software market growth.
The procurement software market size is estimated to grow at a CAGR of 10.2% between 2022 and 2027. The procurement software market size is forecast to increase by USD 4,903.04 million. This procurement software market report extensively covers market segmentation by deployment (cloud and on-premises), end-user (retail and e-commerce, healthcare and pharmaceuticals, manufacturing and automotive, IT and telecom, BFSI, and others), and geography (North America, Europe, APAC, South America, and Middle East and Africa). The improvements in business efficiency are notably driving market growth.
|
Expense Management Software Market Scope |
|
|
Report Coverage |
Details |
|
Historic period |
2017-2021 |
|
Forecast period |
2023-2027 |
|
Growth momentum & CAGR |
Accelerate at a CAGR of 13.75% |
|
Market growth 2023-2027 |
USD 4,776.21 million |
|
Market structure |
Fragmented |
|
YoY growth 2022-2023 (%) |
12.25 |
|
Regional analysis |
North America, Europe, APAC, South America, and Middle East and Africa |
|
Performing market contribution |
North America at 40% |
|
Key countries |
US, China, France, Germany, and UK, Canada, Mexico, Italy,Spain, India, Japan, Australia, and South Korea |
|
Competitive landscape |
Leading Vendors, Market Positioning of Vendors, Competitive Strategies, and Industry Risks |
|
Key companies profiled |
Coupa Software Inc., Emburse Inc., Expensify Inc., Fyle Technologies Pvt. Ltd., Insperity Services L.P., International Business Machines Corp., Intuit Inc., ITILITE, Koch Industries Inc., Oracle Corp., Sage Group Plc, SAP SE, Sodexo SA, The Access Group, VA Tech Ventures Pvt. Ltd., Webexpenses Pty Ltd., Workday Inc., Xero Ltd., Zaggle Prepaid Ocean Services Pvt. Ltd., and Zoho Corp. Pvt. Ltd. |
|
Market dynamics |
Parent market analysis, Market growth inducers and obstacles, Fast-growing and slow-growing segment analysis, COVID-19 impact and recovery analysis and future consumer dynamics, Market condition analysis for forecast period. |
|
Customization purview |
If our report has not included the data that you are looking for, you can reach out to our analysts and get segments customized. |
Table of Contents
1 Executive Summary
- 1.1 Market overview
- Exhibit 01: Executive Summary – Chart on Market Overview
- Exhibit 02: Executive Summary – Data Table on Market Overview
- Exhibit 03: Executive Summary – Chart on Global Market Characteristics
- Exhibit 04: Executive Summary – Chart on Market by Geography
- Exhibit 05: Executive Summary – Chart on Market Segmentation by Component
- Exhibit 06: Executive Summary – Chart on Market Segmentation by Application
- Exhibit 07: Executive Summary – Chart on Incremental Growth
- Exhibit 08: Executive Summary – Data Table on Incremental Growth
- Exhibit 09: Executive Summary – Chart on Vendor Market Positioning
2 Market Landscape
- 2.1 Market ecosystem
- Exhibit 10: Parent market
- Exhibit 11: Market Characteristics
3 Market Sizing
- 3.1 Market definition
- Exhibit 12: Offerings of vendors included in the market definition
- 3.2 Market segment analysis
- Exhibit 13: Market segments
- 3.3 Market size 2022
- 3.4 Market outlook: Forecast for 2022-2027
- Exhibit 14: Chart on Global – Market size and forecast 2022-2027 ($ million)
- Exhibit 15: Data Table on Global – Market size and forecast 2022-2027 ($ million)
- Exhibit 16: Chart on Global Market: Year-over-year growth 2022-2027 (%)
- Exhibit 17: Data Table on Global Market: Year-over-year growth 2022-2027 (%)
4 Historic Market Size
- 4.1 Global expense management software market 2017 – 2021
- Exhibit 18: Historic Market Size – Data Table on global expense management software market 2017 – 2021 ($ million)
- 4.2 Component Segment Analysis 2017 – 2021
- Exhibit 19: Historic Market Size – Component Segment 2017 – 2021 ($ million)
- 4.3 Application Segment Analysis 2017 – 2021
- Exhibit 20: Historic Market Size – Application Segment 2017 – 2021 ($ million)
- 4.4 Geography Segment Analysis 2017 – 2021
- Exhibit 21: Historic Market Size – Geography Segment 2017 – 2021 ($ million)
- 4.5 Country Segment Analysis 2017 – 2021
- Exhibit 22: Historic Market Size – Country Segment 2017 – 2021 ($ million)
5 Five Forces Analysis
- 5.1 Five forces summary
- Exhibit 23: Five forces analysis – Comparison between 2022 and 2027
- 5.2 Bargaining power of buyers
- Exhibit 24: Chart on Bargaining power of buyers – Impact of key factors 2022 and 2027
- 5.3 Bargaining power of suppliers
- Exhibit 25: Bargaining power of suppliers – Impact of key factors in 2022 and 2027
- 5.4 Threat of new entrants
- Exhibit 26: Threat of new entrants – Impact of key factors in 2022 and 2027
- 5.5 Threat of substitutes
- Exhibit 27: Threat of substitutes – Impact of key factors in 2022 and 2027
- 5.6 Threat of rivalry
- Exhibit 28: Threat of rivalry – Impact of key factors in 2022 and 2027
- 5.7 Market condition
- Exhibit 29: Chart on Market condition – Five forces 2022 and 2027
6 Market Segmentation by Component
- 6.1 Market segments
- Exhibit 30: Chart on Component – Market share 2022-2027 (%)
- Exhibit 31: Data Table on Component – Market share 2022-2027 (%)
- 6.2 Comparison by Component
- Exhibit 32: Chart on Comparison by Component
- Exhibit 33: Data Table on Comparison by Component
- 6.3 Solution – Market size and forecast 2022-2027
- Exhibit 34: Chart on Solution – Market size and forecast 2022-2027 ($ million)
- Exhibit 35: Data Table on Solution – Market size and forecast 2022-2027 ($ million)
- Exhibit 36: Chart on Solution – Year-over-year growth 2022-2027 (%)
- Exhibit 37: Data Table on Solution – Year-over-year growth 2022-2027 (%)
- 6.4 Service – Market size and forecast 2022-2027
- Exhibit 38: Chart on Service – Market size and forecast 2022-2027 ($ million)
- Exhibit 39: Data Table on Service – Market size and forecast 2022-2027 ($ million)
- Exhibit 40: Chart on Service – Year-over-year growth 2022-2027 (%)
- Exhibit 41: Data Table on Service – Year-over-year growth 2022-2027 (%)
- 6.5 Market opportunity by Component
- Exhibit 42: Market opportunity by Component ($ million)
- Exhibit 43: Data Table on Market opportunity by Component ($ million)
7 Market Segmentation by Application
- 7.1 Market segments
- Exhibit 44: Chart on Application – Market share 2022-2027 (%)
- Exhibit 45: Data Table on Application – Market share 2022-2027 (%)
- 7.2 Comparison by Application
- Exhibit 46: Chart on Comparison by Application
- Exhibit 47: Data Table on Comparison by Application
- 7.3 Large enterprises – Market size and forecast 2022-2027
- Exhibit 48: Chart on Large enterprises – Market size and forecast 2022-2027 ($ million)
- Exhibit 49: Data Table on Large enterprises – Market size and forecast 2022-2027 ($ million)
- Exhibit 50: Chart on Large enterprises – Year-over-year growth 2022-2027 (%)
- Exhibit 51: Data Table on Large enterprises – Year-over-year growth 2022-2027 (%)
- 7.4 SMEs – Market size and forecast 2022-2027
- Exhibit 52: Chart on SMEs – Market size and forecast 2022-2027 ($ million)
- Exhibit 53: Data Table on SMEs – Market size and forecast 2022-2027 ($ million)
- Exhibit 54: Chart on SMEs – Year-over-year growth 2022-2027 (%)
- Exhibit 55: Data Table on SMEs – Year-over-year growth 2022-2027 (%)
- 7.5 Market opportunity by Application
- Exhibit 56: Market opportunity by Application ($ million)
- Exhibit 57: Data Table on Market opportunity by Application ($ million)
8 Customer Landscape
- 8.1 Customer landscape overview
- Exhibit 58: Analysis of price sensitivity, lifecycle, customer purchase basket, adoption rates, and purchase criteria
9 Geographic Landscape
- 9.1 Geographic segmentation
- Exhibit 59: Chart on Market share by geography 2022-2027 (%)
- Exhibit 60: Data Table on Market share by geography 2022-2027 (%)
- 9.2 Geographic comparison
- Exhibit 61: Chart on Geographic comparison
- Exhibit 62: Data Table on Geographic comparison
- 9.3 North America – Market size and forecast 2022-2027
- Exhibit 63: Chart on North America – Market size and forecast 2022-2027 ($ million)
- Exhibit 64: Data Table on North America – Market size and forecast 2022-2027 ($ million)
- Exhibit 65: Chart on North America – Year-over-year growth 2022-2027 (%)
- Exhibit 66: Data Table on North America – Year-over-year growth 2022-2027 (%)
- 9.4 Europe – Market size and forecast 2022-2027
- Exhibit 67: Chart on Europe – Market size and forecast 2022-2027 ($ million)
- Exhibit 68: Data Table on Europe – Market size and forecast 2022-2027 ($ million)
- Exhibit 69: Chart on Europe – Year-over-year growth 2022-2027 (%)
- Exhibit 70: Data Table on Europe – Year-over-year growth 2022-2027 (%)
- 9.5 APAC – Market size and forecast 2022-2027
- Exhibit 71: Chart on APAC – Market size and forecast 2022-2027 ($ million)
- Exhibit 72: Data Table on APAC – Market size and forecast 2022-2027 ($ million)
- Exhibit 73: Chart on APAC – Year-over-year growth 2022-2027 (%)
- Exhibit 74: Data Table on APAC – Year-over-year growth 2022-2027 (%)
- 9.6 South America – Market size and forecast 2022-2027
- Exhibit 75: Chart on South America – Market size and forecast 2022-2027 ($ million)
- Exhibit 76: Data Table on South America – Market size and forecast 2022-2027 ($ million)
- Exhibit 77: Chart on South America – Year-over-year growth 2022-2027 (%)
- Exhibit 78: Data Table on South America – Year-over-year growth 2022-2027 (%)
- 9.7 Middle East and Africa – Market size and forecast 2022-2027
- Exhibit 79: Chart on Middle East and Africa – Market size and forecast 2022-2027 ($ million)
- Exhibit 80: Data Table on Middle East and Africa – Market size and forecast 2022-2027 ($ million)
- Exhibit 81: Chart on Middle East and Africa – Year-over-year growth 2022-2027 (%)
- Exhibit 82: Data Table on Middle East and Africa – Year-over-year growth 2022-2027 (%)
- 9.8 US – Market size and forecast 2022-2027
- Exhibit 83: Chart on US – Market size and forecast 2022-2027 ($ million)
- Exhibit 84: Data Table on US – Market size and forecast 2022-2027 ($ million)
- Exhibit 85: Chart on US – Year-over-year growth 2022-2027 (%)
- Exhibit 86: Data Table on US – Year-over-year growth 2022-2027 (%)
- 9.9 France – Market size and forecast 2022-2027
- Exhibit 87: Chart on France – Market size and forecast 2022-2027 ($ million)
- Exhibit 88: Data Table on France – Market size and forecast 2022-2027 ($ million)
- Exhibit 89: Chart on France – Year-over-year growth 2022-2027 (%)
- Exhibit 90: Data Table on France – Year-over-year growth 2022-2027 (%)
- 9.10 Germany – Market size and forecast 2022-2027
- Exhibit 91: Chart on Germany – Market size and forecast 2022-2027 ($ million)
- Exhibit 92: Data Table on Germany – Market size and forecast 2022-2027 ($ million)
- Exhibit 93: Chart on Germany – Year-over-year growth 2022-2027 (%)
- Exhibit 94: Data Table on Germany – Year-over-year growth 2022-2027 (%)
- 9.11 UK – Market size and forecast 2022-2027
- Exhibit 95: Chart on UK – Market size and forecast 2022-2027 ($ million)
- Exhibit 96: Data Table on UK – Market size and forecast 2022-2027 ($ million)
- Exhibit 97: Chart on UK – Year-over-year growth 2022-2027 (%)
- Exhibit 98: Data Table on UK – Year-over-year growth 2022-2027 (%)
- 9.12 China – Market size and forecast 2022-2027
- Exhibit 99: Chart on China – Market size and forecast 2022-2027 ($ million)
- Exhibit 100: Data Table on China – Market size and forecast 2022-2027 ($ million)
- Exhibit 101: Chart on China – Year-over-year growth 2022-2027 (%)
- Exhibit 102: Data Table on China – Year-over-year growth 2022-2027 (%)
- 9.13 Market opportunity by geography
- Exhibit 103: Market opportunity by geography ($ million)
- Exhibit 104: Data Tables on Market opportunity by geography ($ million)
10 Drivers, Challenges, and Trends
- 10.1 Market drivers
- 10.2 Market challenges
- 10.3 Impact of drivers and challenges
- Exhibit 105: Impact of drivers and challenges in 2022 and 2027
- 10.4 Market trends
11 Vendor Landscape
- 11.1 Overview
- 11.2 Vendor landscape
- Exhibit 106: Overview on Criticality of inputs and Factors of differentiation
- 11.3 Landscape disruption
- Exhibit 107: Overview on factors of disruption
- 11.4 Industry risks
- Exhibit 108: Impact of key risks on business
12 Vendor Analysis
- 12.1 Vendors covered
- Exhibit 109: Vendors covered
- 12.2 Market positioning of vendors
- Exhibit 110: Matrix on vendor position and classification
- 12.3 Coupa Software Inc.
- Exhibit 111: Coupa Software Inc. – Overview
- Exhibit 112: Coupa Software Inc. – Product / Service
- Exhibit 113: Coupa Software Inc. – Key offerings
- 12.4 Emburse Inc.
- Exhibit 114: Emburse Inc. – Overview
- Exhibit 115: Emburse Inc. – Product / Service
- Exhibit 116: Emburse Inc. – Key offerings
- 12.5 Expensify Inc.
- Exhibit 117: Expensify Inc. – Overview
- Exhibit 118: Expensify Inc. – Product / Service
- Exhibit 119: Expensify Inc. – Key offerings
- 12.6 Insperity Services L.P.
- Exhibit 120: Insperity Services L.P. – Overview
- Exhibit 121: Insperity Services L.P. – Product / Service
- Exhibit 122: Insperity Services L.P. – Key offerings
- 12.7 International Business Machines Corp.
- Exhibit 123: International Business Machines Corp. – Overview
- Exhibit 124: International Business Machines Corp. – Business segments
- Exhibit 125: International Business Machines Corp. – Key news
- Exhibit 126: International Business Machines Corp. – Key offerings
- Exhibit 127: International Business Machines Corp. – Segment focus
- 12.8 Intuit Inc.
- Exhibit 128: Intuit Inc. – Overview
- Exhibit 129: Intuit Inc. – Business segments
- Exhibit 130: Intuit Inc. – Key offerings
- Exhibit 131: Intuit Inc. – Segment focus
- 12.9 Koch Industries Inc.
- Exhibit 132: Koch Industries Inc. – Overview
- Exhibit 133: Koch Industries Inc. – Product / Service
- Exhibit 134: Koch Industries Inc. – Key news
- Exhibit 135: Koch Industries Inc. – Key offerings
- 12.10 Oracle Corp.
- Exhibit 136: Oracle Corp. – Overview
- Exhibit 137: Oracle Corp. – Business segments
- Exhibit 138: Oracle Corp. – Key news
- Exhibit 139: Oracle Corp. – Key offerings
- Exhibit 140: Oracle Corp. – Segment focus
- 12.11 Sage Group Plc
- Exhibit 141: Sage Group Plc – Overview
- Exhibit 142: Sage Group Plc – Business segments
- Exhibit 143: Sage Group Plc – Key offerings
- Exhibit 144: Sage Group Plc – Segment focus
- 12.12 SAP SE
- Exhibit 145: SAP SE – Overview
- Exhibit 146: SAP SE – Business segments
- Exhibit 147: SAP SE – Key news
- Exhibit 148: SAP SE – Key offerings
- Exhibit 149: SAP SE – Segment focus
- 12.13 Sodexo SA
- Exhibit 150: Sodexo SA – Overview
- Exhibit 151: Sodexo SA – Business segments
- Exhibit 152: Sodexo SA – Key news
- Exhibit 153: Sodexo SA – Key offerings
- Exhibit 154: Sodexo SA – Segment focus
- 12.14 The Access Group
- Exhibit 155: The Access Group – Overview
- Exhibit 156: The Access Group – Product / Service
- Exhibit 157: The Access Group – Key offerings
- 12.15 Workday Inc.
- Exhibit 158: Workday Inc. – Overview
- Exhibit 159: Workday Inc. – Product / Service
- Exhibit 160: Workday Inc. – Key news
- Exhibit 161: Workday Inc. – Key offerings
- 12.16 Xero Ltd.
- Exhibit 162: Xero Ltd. – Overview
- Exhibit 163: Xero Ltd. – Business segments
- Exhibit 164: Xero Ltd. – Key offerings
- Exhibit 165: Xero Ltd. – Segment focus
- 12.17 Zaggle Prepaid Ocean Services Pvt. Ltd.
- Exhibit 166: Zaggle Prepaid Ocean Services Pvt. Ltd. – Overview
- Exhibit 167: Zaggle Prepaid Ocean Services Pvt. Ltd. – Product / Service
- Exhibit 168: Zaggle Prepaid Ocean Services Pvt. Ltd. – Key offerings
13 Appendix
- 13.1 Scope of the report
- 13.2 Inclusions and exclusions checklist
- Exhibit 169: Inclusions checklist
- Exhibit 170: Exclusions checklist
- 13.3 Currency conversion rates for US$
- Exhibit 171: Currency conversion rates for US$
- 13.4 Research methodology
- Exhibit 172: Research methodology
- Exhibit 173: Validation techniques employed for market sizing
- Exhibit 174: Information sources
- 13.5 List of abbreviations
- Exhibit 175: List of abbreviations
About Us
Technavio is a leading global technology research and advisory company. Their research and analysis focuses on emerging market trends and provides actionable insights to help businesses identify market opportunities and develop effective strategies to optimize their market positions. With over 500 specialized analysts, Technavio’s report library consists of more than 17,000 reports and counting, covering 800 technologies, spanning across 50 countries. Their client base consists of enterprises of all sizes, including more than 100 Fortune 500 companies. This growing client base relies on Technavio’s comprehensive coverage, extensive research, and actionable market insights to identify opportunities in existing and potential markets and assess their competitive positions within changing market scenarios.
Contact
Technavio Research
Jesse Maida
Media & Marketing Executive
US: +1 844 364 1100
UK: +44 203 893 3200
Email: media@technavio.com
Website: www.technavio.com
![]()
![]() View original content to download multimedia:https://www.prnewswire.com/news-releases/expense-management-software-market-size-to-grow-by-usd-4-776-21-million-from-2022-to-2027–increasing-adoption-of-cloud-based-solutions-to-boost-the-market-growth—technavio-301839953.html
View original content to download multimedia:https://www.prnewswire.com/news-releases/expense-management-software-market-size-to-grow-by-usd-4-776-21-million-from-2022-to-2027–increasing-adoption-of-cloud-based-solutions-to-boost-the-market-growth—technavio-301839953.html
SOURCE Technavio
