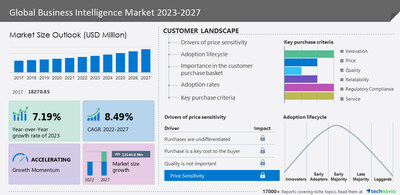
NEW YORK, May 15, 2023 /PRNewswire/ — The global business intelligence market size is estimated to grow by USD 12,144.6 million from 2022 to 2027. The market’s growth momentum will progress at a CAGR of 8.49%. The growing demand for BI in retail is driving market growth. The retail industry generates large amounts of data from sales transactions, customer interactions, inventory management, and other sources. BI tools can help retailers gain operational insights, optimize strategies, and improve performance. They can analyze sales data by product, location, time period, customer segment, and other variables, as well as identify trends, patterns, and growth opportunities. This allows retailers to personalize products and improve customer satisfaction. These factors will fuel the growth of the market during the forecast period. Discover some insights on market size historic period (2017 to 2021) and forecast (2023-2027) before buying the full report – Request a sample report

Business intelligence market – Customer landscape
Our report analyzes the life cycle of the global business intelligence market from the innovator’s stage to the laggard’s stage. The report illustrates the lifecycle of the global business intelligence market, focusing on the adoption rates of the major countries such as the US, Canada, China, India, Japan, and Germany. To help companies evaluate and develop growth strategies, the report outlines –
- Key purchase criteria
- Adoption rates
- Adoption lifecycles
- Drivers of price sensitivity
- To unlock the detailed information on the customer landscape – Request a sample now!
Business intelligence market – Vendor analysis
Vendor landscape –
The global business intelligence market is fragmented, with the presence of several global as well as regional vendors. A few prominent vendors that offer business intelligence in the market are Amazon.com Inc., Arbela Technologies Corp., Global Software LLC, Hitachi Ltd., Idera Inc., InetSoft Technology Corp., International Business Machines Corp., Microsoft Corp., MicroStrategy Inc., Oracle Corp., Palantir Technologies Inc., Panorama Software Inc., SAP SE, SAS Institute Inc., ScienceSoft USA Corp., Sisense Ltd., TARGIT AS, TIBCO Software Inc., QlikTech international AB, and Salesforce.com Inc. and others.
There is intense competition among vendors in terms of product features, price, customized solutions, and services offered. Established vendors are expected to focus on strategies such as geographical expansion, production capacities, and upselling of products by upgrading the existing ones. They will have to strengthen their strategies to hold on to their current market, as the competitive environment in this market is expected to intensify during the forecast period.
What’s new? –
- Special coverage on the Russia–Ukraine war; global inflation; recovery analysis from COVID-19; supply chain disruptions, global trade tensions; and risk of recession
- Global competitiveness and key competitor positions
- Market presence across multiple geographical footprints – Strong/active/niche/trivial – Buy the report!
Vendor offerings –
- Amazon.com Inc. – The company offers business intelligence solutions, namely Amazon QuickSight.
- Global Software LLC – The company offers business intelligence solutions through its subsidiary Logi Analytics Inc.
- Hitachi Ltd. – The company offers business intelligence solutions through its subsidiary Hitachi Vantara LLC.
- InetSoft Technology Corp. – The company offers business intelligence solutions such as InetSoft Hosted Cloud Flexible BI.
- For details on the vendor and its offerings – Request a sample report
Business Intelligence Market – Segmentation assessment
Segment overview
Technavio has segmented the market based on end-user (BFSI, healthcare, ICT, government, and others), deployment (on-premise and cloud), and geography (North America, APAC, Europe, Middle East and Africa, and South America).
- The BFSI segment will account for a significant share of market growth during the forecast period. In recent years, the fast advent of digitalization has transformed the BFSI industry. Technology companies such as Google LLC, Amazon.com Inc., and Paytm have developed payment and banking apps for their customers. They have partnered with banks and leveraged their large user base to enter the fintech industry. Banks use technologies and tools such as BI and data analytics to meet customers’ needs. These technologies help financial institutions make smarter decisions, which will drive the growth of this segment during the forecast period.
Geography overview
Based on geography, the global business intelligence market is segmented into North America, APAC, Europe, Middle East and Africa, and South America. The report provides actionable insights and estimates the contribution of all regions to the growth of the global business intelligence market.
- North America is estimated to account for 34% of the growth of the global business intelligence market during the forecast period. North America is an important market for BI platforms, as the region is an early adopter of advanced technologies. Moreover, the region has some of the leading providers and consumers of data. Therefore, the large amount of data generated in North America is driving the growth of the regional market.
For insights on global, regional, and country-level parameters with growth opportunities from 2017 to 2027 – Download a sample report
Business intelligence market – Market dynamics
Key trends – The rising adoption of smart connected devices is a key trend in the market. The adoption of smart connected devices such as smartphones, tablets, wearables, and IoT devices is increasing the use of BI. These devices generate large amounts of data that can be collected and analyzed to generate valuable insights. Smart devices enable real-time data collection and analysis, which helps organizations make faster and more informed decisions. Therefore, the increasing adoption of smart connected devices is driving the growth of the BI market, as BI tools enable organizations to collect and analyze large amounts of data in real-time.
Major challenges – Rising concern for data privacy is challenging market growth. Large clusters of disparate systems and data silos within an organization are connected by business analytics solutions to collect data. Predictive models also pose a security risk, as they have access all sensitive information. In addition, administrative errors can create security loopholes that can be used by hackers. These issues can ultimately lead to loss of brand loyalty, expensive litigation, and costly insurance claims. Therefore, data security and privacy concerns will pose a threat to the BI market during the forecast period.
What are the key data covered in this business intelligence market report?
- CAGR of the market during the forecast period
- Detailed information on factors that will drive the growth of the business intelligence market between 2023 and 2027
- Precise estimation of the size of the business intelligence market and its contribution to the parent market
- Accurate predictions about upcoming trends and changes in consumer behavior
- Growth of the business intelligence market across North America, APAC, Europe, Middle East and Africa, and South America
- A thorough analysis of the market’s competitive landscape and detailed information about vendors
- Comprehensive analysis of factors that will challenge the growth of business intelligence market vendors
Gain instant access to 17,000+ market research reports.
Technavio’s SUBSCRIPTION platform
Related Reports:
The IT business process outsourcing (BPO) market size is expected to increase by USD 281.25 billion from 2021 to 2026, and the market’s growth momentum will accelerate at a CAGR of 8.12%. Furthermore, this report extensively covers market segmentation by type (IT-related BPO, contact centers BPO, and others) and geography (North America, Europe, APAC, South America, and the Middle East and Africa).
The business information market is estimated to grow at a CAGR of 8.2% between 2022 and 2027. The size of the market is forecasted to increase by USD 80.42 billion. This report extensively covers market segmentation by end-user (BFSI, healthcare and life sciences, manufacturing, retail, and others), application (b2b and b2c), and geography (North America, Europe, APAC, South America, and Middle East and Africa).
|
Business Intelligence Market Scope |
|
|
Report Coverage |
Details |
|
Base year |
2022 |
|
Historic period |
2017-2021 |
|
Forecast period |
2023-2027 |
|
Growth momentum & CAGR |
Accelerate at a CAGR of 8.49% |
|
Market growth 2023-2027 |
USD 12,144.6 million |
|
Market structure |
Fragmented |
|
YoY growth 2022-2023 (%) |
7.19 |
|
Regional analysis |
North America, APAC, Europe, Middle East and Africa, and South America |
|
Performing market contribution |
North America at 34% |
|
Key countries |
US, China, India, UK, and Germany |
|
Competitive landscape |
Leading vendors, market positioning of vendors, competitive strategies, and industry risks |
|
Key companies profiled |
Amazon.com Inc., Arbela Technologies Corp., Global Software LLC, Hitachi Ltd., Idera Inc., InetSoft Technology Corp., International Business Machines Corp., Microsoft Corp., MicroStrategy Inc., Oracle Corp., Palantir Technologies Inc., Panorama Software Inc., SAP SE, SAS Institute Inc., ScienceSoft USA Corp., Sisense Ltd., TARGIT AS, TIBCO Software Inc., QlikTech international AB, and Salesforce.com Inc. |
|
Market dynamics |
Parent market analysis, market growth inducers and obstacles, fast-growing and slow-growing segment analysis, COVID-19 impact and recovery analysis and future consumer dynamics, and market condition analysis for the forecast period. |
|
Customization purview |
If our report has not included the data that you are looking for, you can reach out to our analysts and get segments customized. |
Browse for Technavio Information Technology market reports
Table of contents
1 Executive Summary
- 1.1 Market overview
- Exhibit 01: Executive Summary – Chart on Market Overview
- Exhibit 02: Executive Summary – Data Table on Market Overview
- Exhibit 03: Executive Summary – Chart on Global Market Characteristics
- Exhibit 04: Executive Summary – Chart on Market by Geography
- Exhibit 05: Executive Summary – Chart on Market Segmentation by End-user
- Exhibit 06: Executive Summary – Chart on Market Segmentation by Deployment
- Exhibit 07: Executive Summary – Chart on Incremental Growth
- Exhibit 08: Executive Summary – Data Table on Incremental Growth
- Exhibit 09: Executive Summary – Chart on Vendor Market Positioning
2 Market Landscape
- 2.1 Market ecosystem
- Exhibit 10: Parent market
- Exhibit 11: Market Characteristics
3 Market Sizing
- 3.1 Market definition
- Exhibit 12: Offerings of vendors included in the market definition
- 3.2 Market segment analysis
- Exhibit 13: Market segments
- 3.3 Market size 2022
- 3.4 Market outlook: Forecast for 2022-2027
- Exhibit 14: Chart on Global – Market size and forecast 2022-2027 ($ million)
- Exhibit 15: Data Table on Global – Market size and forecast 2022-2027 ($ million)
- Exhibit 16: Chart on Global Market: Year-over-year growth 2022-2027 (%)
- Exhibit 17: Data Table on Global Market: Year-over-year growth 2022-2027 (%)
4 Historic Market Size
- 4.1 Global business intelligence market 2017 – 2021
- Exhibit 18: Historic Market Size – Data Table on global business intelligence market 2017 – 2021 ($ million)
- 4.2 End-user Segment Analysis 2017 – 2021
- Exhibit 19: Historic Market Size – End-user Segment 2017 – 2021 ($ million)
- 4.3 Deployment Segment Analysis 2017 – 2021
- Exhibit 20: Historic Market Size – Deployment Segment 2017 – 2021 ($ million)
- 4.4 Geography Segment Analysis 2017 – 2021
- Exhibit 21: Historic Market Size – Geography Segment 2017 – 2021 ($ million)
- 4.5 Country Segment Analysis 2017 – 2021
- Exhibit 22: Historic Market Size – Country Segment 2017 – 2021 ($ million)
5 Five Forces Analysis
- 5.1 Five forces summary
- Exhibit 23: Five forces analysis – Comparison between 2022 and 2027
- 5.2 Bargaining power of buyers
- Exhibit 24: Chart on Bargaining power of buyers – Impact of key factors 2022 and 2027
- 5.3 Bargaining power of suppliers
- Exhibit 25: Bargaining power of suppliers – Impact of key factors in 2022 and 2027
- 5.4 Threat of new entrants
- Exhibit 26: Threat of new entrants – Impact of key factors in 2022 and 2027
- 5.5 Threat of substitutes
- Exhibit 27: Threat of substitutes – Impact of key factors in 2022 and 2027
- 5.6 Threat of rivalry
- Exhibit 28: Threat of rivalry – Impact of key factors in 2022 and 2027
- 5.7 Market condition
- Exhibit 29: Chart on Market condition – Five forces 2022 and 2027
6 Market Segmentation by End-user
- 6.1 Market segments
- Exhibit 30: Chart on End-user – Market share 2022-2027 (%)
- Exhibit 31: Data Table on End-user – Market share 2022-2027 (%)
- 6.2 Comparison by End-user
- Exhibit 32: Chart on Comparison by End-user
- Exhibit 33: Data Table on Comparison by End-user
- 6.3 BFSI – Market size and forecast 2022-2027
- Exhibit 34: Chart on BFSI – Market size and forecast 2022-2027 ($ million)
- Exhibit 35: Data Table on BFSI – Market size and forecast 2022-2027 ($ million)
- Exhibit 36: Chart on BFSI – Year-over-year growth 2022-2027 (%)
- Exhibit 37: Data Table on BFSI – Year-over-year growth 2022-2027 (%)
- 6.4 Healthcare – Market size and forecast 2022-2027
- Exhibit 38: Chart on Healthcare – Market size and forecast 2022-2027 ($ million)
- Exhibit 39: Data Table on Healthcare – Market size and forecast 2022-2027 ($ million)
- Exhibit 40: Chart on Healthcare – Year-over-year growth 2022-2027 (%)
- Exhibit 41: Data Table on Healthcare – Year-over-year growth 2022-2027 (%)
- 6.5 ICT – Market size and forecast 2022-2027
- Exhibit 42: Chart on ICT – Market size and forecast 2022-2027 ($ million)
- Exhibit 43: Data Table on ICT – Market size and forecast 2022-2027 ($ million)
- Exhibit 44: Chart on ICT – Year-over-year growth 2022-2027 (%)
- Exhibit 45: Data Table on ICT – Year-over-year growth 2022-2027 (%)
- 6.6 Government – Market size and forecast 2022-2027
- Exhibit 46: Chart on Government – Market size and forecast 2022-2027 ($ million)
- Exhibit 47: Data Table on Government – Market size and forecast 2022-2027 ($ million)
- Exhibit 48: Chart on Government – Year-over-year growth 2022-2027 (%)
- Exhibit 49: Data Table on Government – Year-over-year growth 2022-2027 (%)
- 6.7 Others – Market size and forecast 2022-2027
- Exhibit 50: Chart on Others – Market size and forecast 2022-2027 ($ million)
- Exhibit 51: Data Table on Others – Market size and forecast 2022-2027 ($ million)
- Exhibit 52: Chart on Others – Year-over-year growth 2022-2027 (%)
- Exhibit 53: Data Table on Others – Year-over-year growth 2022-2027 (%)
- 6.8 Market opportunity by End-user
- Exhibit 54: Market opportunity by End-user ($ million)
- Exhibit 55: Data Table on Market opportunity by End-user ($ million)
7 Market Segmentation by Deployment
- 7.1 Market segments
- Exhibit 56: Chart on Deployment – Market share 2022-2027 (%)
- Exhibit 57: Data Table on Deployment – Market share 2022-2027 (%)
- 7.2 Comparison by Deployment
- Exhibit 58: Chart on Comparison by Deployment
- Exhibit 59: Data Table on Comparison by Deployment
- 7.3 On-premise – Market size and forecast 2022-2027
- Exhibit 60: Chart on On-premise – Market size and forecast 2022-2027 ($ million)
- Exhibit 61: Data Table on On-premise – Market size and forecast 2022-2027 ($ million)
- Exhibit 62: Chart on On-premise – Year-over-year growth 2022-2027 (%)
- Exhibit 63: Data Table on On-premise – Year-over-year growth 2022-2027 (%)
- 7.4 Cloud – Market size and forecast 2022-2027
- Exhibit 64: Chart on Cloud – Market size and forecast 2022-2027 ($ million)
- Exhibit 65: Data Table on Cloud – Market size and forecast 2022-2027 ($ million)
- Exhibit 66: Chart on Cloud – Year-over-year growth 2022-2027 (%)
- Exhibit 67: Data Table on Cloud – Year-over-year growth 2022-2027 (%)
- 7.5 Market opportunity by Deployment
- Exhibit 68: Market opportunity by Deployment ($ million)
- Exhibit 69: Data Table on Market opportunity by Deployment ($ million)
8 Customer Landscape
- 8.1 Customer landscape overview
- Exhibit 70: Analysis of price sensitivity, lifecycle, customer purchase basket, adoption rates, and purchase criteria
9 Geographic Landscape
- 9.1 Geographic segmentation
- Exhibit 71: Chart on Market share by geography 2022-2027 (%)
- Exhibit 72: Data Table on Market share by geography 2022-2027 (%)
- 9.2 Geographic comparison
- Exhibit 73: Chart on Geographic comparison
- Exhibit 74: Data Table on Geographic comparison
- 9.3 North America – Market size and forecast 2022-2027
- Exhibit 75: Chart on North America – Market size and forecast 2022-2027 ($ million)
- Exhibit 76: Data Table on North America – Market size and forecast 2022-2027 ($ million)
- Exhibit 77: Chart on North America – Year-over-year growth 2022-2027 (%)
- Exhibit 78: Data Table on North America – Year-over-year growth 2022-2027 (%)
- 9.4 APAC – Market size and forecast 2022-2027
- Exhibit 79: Chart on APAC – Market size and forecast 2022-2027 ($ million)
- Exhibit 80: Data Table on APAC – Market size and forecast 2022-2027 ($ million)
- Exhibit 81: Chart on APAC – Year-over-year growth 2022-2027 (%)
- Exhibit 82: Data Table on APAC – Year-over-year growth 2022-2027 (%)
- 9.5 Europe – Market size and forecast 2022-2027
- Exhibit 83: Chart on Europe – Market size and forecast 2022-2027 ($ million)
- Exhibit 84: Data Table on Europe – Market size and forecast 2022-2027 ($ million)
- Exhibit 85: Chart on Europe – Year-over-year growth 2022-2027 (%)
- Exhibit 86: Data Table on Europe – Year-over-year growth 2022-2027 (%)
- 9.6 Middle East and Africa – Market size and forecast 2022-2027
- Exhibit 87: Chart on Middle East and Africa – Market size and forecast 2022-2027 ($ million)
- Exhibit 88: Data Table on Middle East and Africa – Market size and forecast 2022-2027 ($ million)
- Exhibit 89: Chart on Middle East and Africa – Year-over-year growth 2022-2027 (%)
- Exhibit 90: Data Table on Middle East and Africa – Year-over-year growth 2022-2027 (%)
- 9.7 South America – Market size and forecast 2022-2027
- Exhibit 91: Chart on South America – Market size and forecast 2022-2027 ($ million)
- Exhibit 92: Data Table on South America – Market size and forecast 2022-2027 ($ million)
- Exhibit 93: Chart on South America – Year-over-year growth 2022-2027 (%)
- Exhibit 94: Data Table on South America – Year-over-year growth 2022-2027 (%)
- 9.8 US – Market size and forecast 2022-2027
- Exhibit 95: Chart on US – Market size and forecast 2022-2027 ($ million)
- Exhibit 96: Data Table on US – Market size and forecast 2022-2027 ($ million)
- Exhibit 97: Chart on US – Year-over-year growth 2022-2027 (%)
- Exhibit 98: Data Table on US – Year-over-year growth 2022-2027 (%)
- 9.9 China – Market size and forecast 2022-2027
- Exhibit 99: Chart on China – Market size and forecast 2022-2027 ($ million)
- Exhibit 100: Data Table on China – Market size and forecast 2022-2027 ($ million)
- Exhibit 101: Chart on China – Year-over-year growth 2022-2027 (%)
- Exhibit 102: Data Table on China – Year-over-year growth 2022-2027 (%)
- 9.10 UK – Market size and forecast 2022-2027
- Exhibit 103: Chart on UK – Market size and forecast 2022-2027 ($ million)
- Exhibit 104: Data Table on UK – Market size and forecast 2022-2027 ($ million)
- Exhibit 105: Chart on UK – Year-over-year growth 2022-2027 (%)
- Exhibit 106: Data Table on UK – Year-over-year growth 2022-2027 (%)
- 9.11 Germany – Market size and forecast 2022-2027
- Exhibit 107: Chart on Germany – Market size and forecast 2022-2027 ($ million)
- Exhibit 108: Data Table on Germany – Market size and forecast 2022-2027 ($ million)
- Exhibit 109: Chart on Germany – Year-over-year growth 2022-2027 (%)
- Exhibit 110: Data Table on Germany – Year-over-year growth 2022-2027 (%)
- 9.12 India – Market size and forecast 2022-2027
- Exhibit 111: Chart on India – Market size and forecast 2022-2027 ($ million)
- Exhibit 112: Data Table on India – Market size and forecast 2022-2027 ($ million)
- Exhibit 113: Chart on India – Year-over-year growth 2022-2027 (%)
- Exhibit 114: Data Table on India – Year-over-year growth 2022-2027 (%)
- 9.13 Market opportunity by geography
- Exhibit 115: Market opportunity by geography ($ million)
- Exhibit 116: Data Tables on Market opportunity by geography ($ million)
10 Drivers, Challenges, and Trends
- 10.1 Market drivers
- 10.2 Market challenges
- 10.3 Impact of drivers and challenges
- Exhibit 117: Impact of drivers and challenges in 2022 and 2027
- 10.4 Market trends
11 Vendor Landscape
- 11.1 Overview
- 11.2 Vendor landscape
- Exhibit 118: Overview on Criticality of inputs and Factors of differentiation
- 11.3 Landscape disruption
- Exhibit 119: Overview on factors of disruption
- 11.4 Industry risks
- Exhibit 120: Impact of key risks on business
12 Vendor Analysis
- 12.1 Vendors covered
- Exhibit 121: Vendors covered
- 12.2 Market positioning of vendors
- Exhibit 122: Matrix on vendor position and classification
- 12.3 Amazon.com Inc.
- Exhibit 123: Amazon.com Inc. – Overview
- Exhibit 124: Amazon.com Inc. – Business segments
- Exhibit 125: Amazon.com Inc. – Key news
- Exhibit 126: Amazon.com Inc. – Key offerings
- Exhibit 127: Amazon.com Inc. – Segment focus
- 12.4 Global Software LLC
- Exhibit 128: Global Software LLC – Overview
- Exhibit 129: Global Software LLC – Product / Service
- Exhibit 130: Global Software LLC – Key offerings
- 12.5 Hitachi Ltd.
- Exhibit 131: Hitachi Ltd. – Overview
- Exhibit 132: Hitachi Ltd. – Business segments
- Exhibit 133: Hitachi Ltd. – Key news
- Exhibit 134: Hitachi Ltd. – Key offerings
- Exhibit 135: Hitachi Ltd. – Segment focus
- 12.6 InetSoft Technology Corp.
- Exhibit 136: InetSoft Technology Corp. – Overview
- Exhibit 137: InetSoft Technology Corp. – Product / Service
- Exhibit 138: InetSoft Technology Corp. – Key offerings
- 12.7 International Business Machines Corp.
- Exhibit 139: International Business Machines Corp. – Overview
- Exhibit 140: International Business Machines Corp. – Business segments
- Exhibit 141: International Business Machines Corp. – Key news
- Exhibit 142: International Business Machines Corp. – Key offerings
- Exhibit 143: International Business Machines Corp. – Segment focus
- 12.8 Microsoft Corp.
- Exhibit 144: Microsoft Corp. – Overview
- Exhibit 145: Microsoft Corp. – Business segments
- Exhibit 146: Microsoft Corp. – Key news
- Exhibit 147: Microsoft Corp. – Key offerings
- Exhibit 148: Microsoft Corp. – Segment focus
- 12.9 MicroStrategy Inc.
- Exhibit 149: MicroStrategy Inc. – Overview
- Exhibit 150: MicroStrategy Inc. – Product / Service
- Exhibit 151: MicroStrategy Inc. – Key offerings
- 12.10 Oracle Corp.
- Exhibit 152: Oracle Corp. – Overview
- Exhibit 153: Oracle Corp. – Business segments
- Exhibit 154: Oracle Corp. – Key news
- Exhibit 155: Oracle Corp. – Key offerings
- Exhibit 156: Oracle Corp. – Segment focus
- 12.11 Palantir Technologies Inc.
- Exhibit 157: Palantir Technologies Inc. – Overview
- Exhibit 158: Palantir Technologies Inc. – Business segments
- Exhibit 159: Palantir Technologies Inc. – Key offerings
- Exhibit 160: Palantir Technologies Inc. – Segment focus
- 12.12 Panorama Software Inc.
- Exhibit 161: Panorama Software Inc. – Overview
- Exhibit 162: Panorama Software Inc. – Key offerings
- 12.13 QlikTech international AB
- Exhibit 163: QlikTech international AB – Overview
- Exhibit 164: QlikTech international AB – Product / Service
- Exhibit 165: QlikTech international AB – Key offerings
- 12.14 Salesforce.com Inc.
- Exhibit 166: Salesforce.com Inc. – Overview
- Exhibit 167: Salesforce.com Inc. – Product / Service
- Exhibit 168: Salesforce.com Inc. – Key news
- Exhibit 169: Salesforce.com Inc. – Key offerings
- 12.15 SAP SE
- Exhibit 170: SAP SE – Overview
- Exhibit 171: SAP SE – Business segments
- Exhibit 172: SAP SE – Key news
- Exhibit 173: SAP SE – Key offerings
- Exhibit 174: SAP SE – Segment focus
- 12.16 SAS Institute Inc.
- Exhibit 175: SAS Institute Inc. – Overview
- Exhibit 176: SAS Institute Inc. – Product / Service
- Exhibit 177: SAS Institute Inc. – Key news
- Exhibit 178: SAS Institute Inc. – Key offerings
- 12.17 TIBCO Software Inc.
- Exhibit 179: TIBCO Software Inc. – Overview
- Exhibit 180: TIBCO Software Inc. – Product / Service
- Exhibit 181: TIBCO Software Inc. – Key offerings
13 Appendix
- 13.1 Scope of the report
- 13.2 Inclusions and exclusions checklist
- Exhibit 182: Inclusions checklist
- Exhibit 183: Exclusions checklist
- 13.3 Currency conversion rates for US$
- Exhibit 184: Currency conversion rates for US$
- 13.4 Research methodology
- Exhibit 185: Research methodology
- Exhibit 186: Validation techniques employed for market sizing
- Exhibit 187: Information sources
- 13.5 List of abbreviations
- Exhibit 188: List of abbreviations
About Us
Technavio is a leading global technology research and advisory company. Their research and analysis focus on emerging market trends and provide actionable insights to help businesses identify market opportunities and develop effective strategies to optimize their market positions. With over 500 specialized analysts, Technavio’s report library consists of more than 17,000 reports and counting, covering 800 technologies, spanning across 50 countries. Their client base consists of enterprises of all sizes, including more than 100 Fortune 500 companies. This growing client base relies on Technavio’s comprehensive coverage, extensive research, and actionable market insights to identify opportunities in existing and potential markets and assess their competitive positions within changing market scenarios.
Contact
Technavio Research
Jesse Maida
Media & Marketing Executive
US: +1 844 364 1100
UK: +44 203 893 3200
Email: media@technavio.com
Website: www.technavio.com/
![]()
![]() View original content to download multimedia:https://www.prnewswire.com/news-releases/business-intelligence-market-size-to-grow-by-usd-12-144-6-million-from-2022-to-2027-growing-demand-for-bi-in-retail-to-boost-growth—technavio-301823516.html
View original content to download multimedia:https://www.prnewswire.com/news-releases/business-intelligence-market-size-to-grow-by-usd-12-144-6-million-from-2022-to-2027-growing-demand-for-bi-in-retail-to-boost-growth—technavio-301823516.html
SOURCE Technavio
